วิธีการดูข้อมูล Log
1.เข้าสู่ระบบ และเข้าในงาน Grafana ด้วยวิธี วิธีใช้งาน Grafana เบื้องต้น
2.เลือก Organization ที่ต้องการที่เมนู switch organization โดยเลือก organization ตามชื่อ service ในระบบ opstella ดังรูป 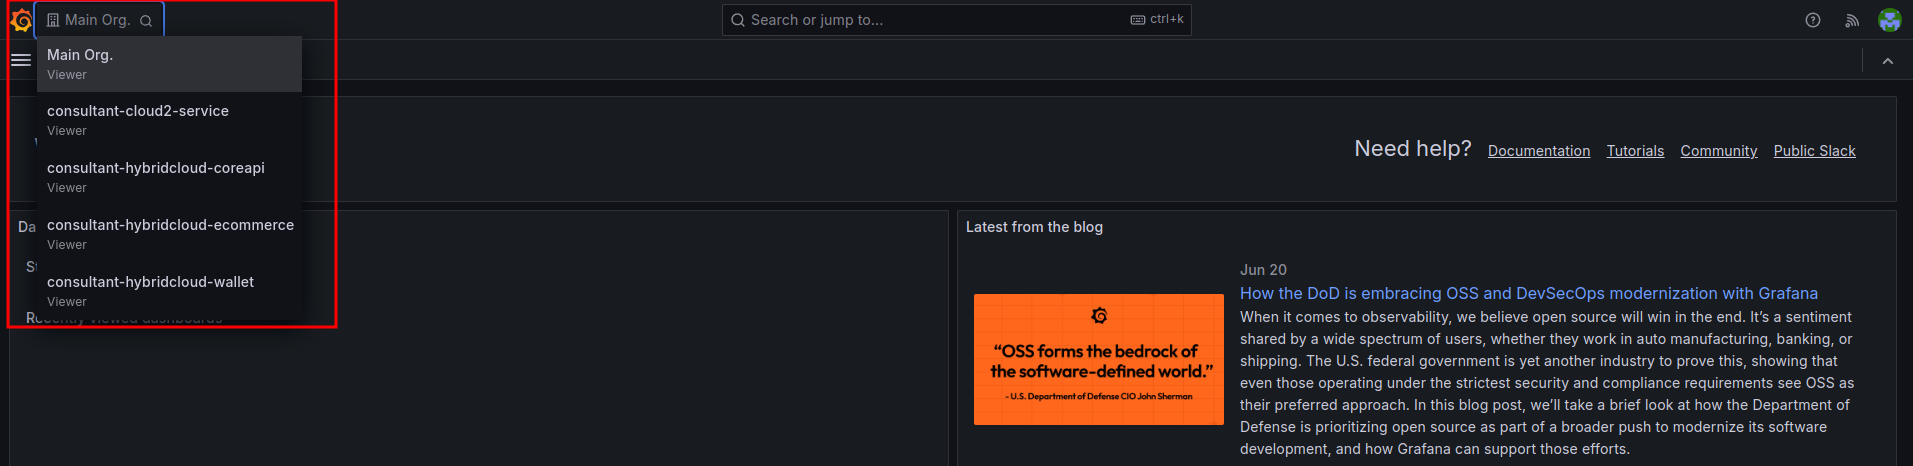
3.เลือกเมนู Dashboard ดังรูป 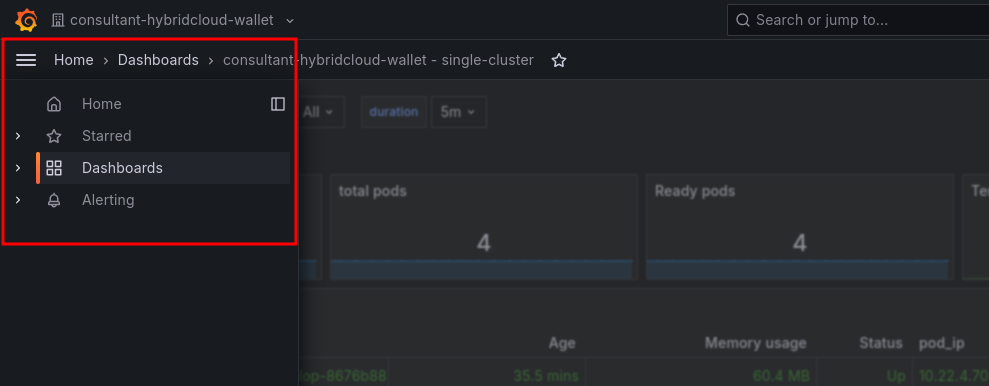
4.คลิกเลือก dashborad ดังรูป เพื่อดู Log 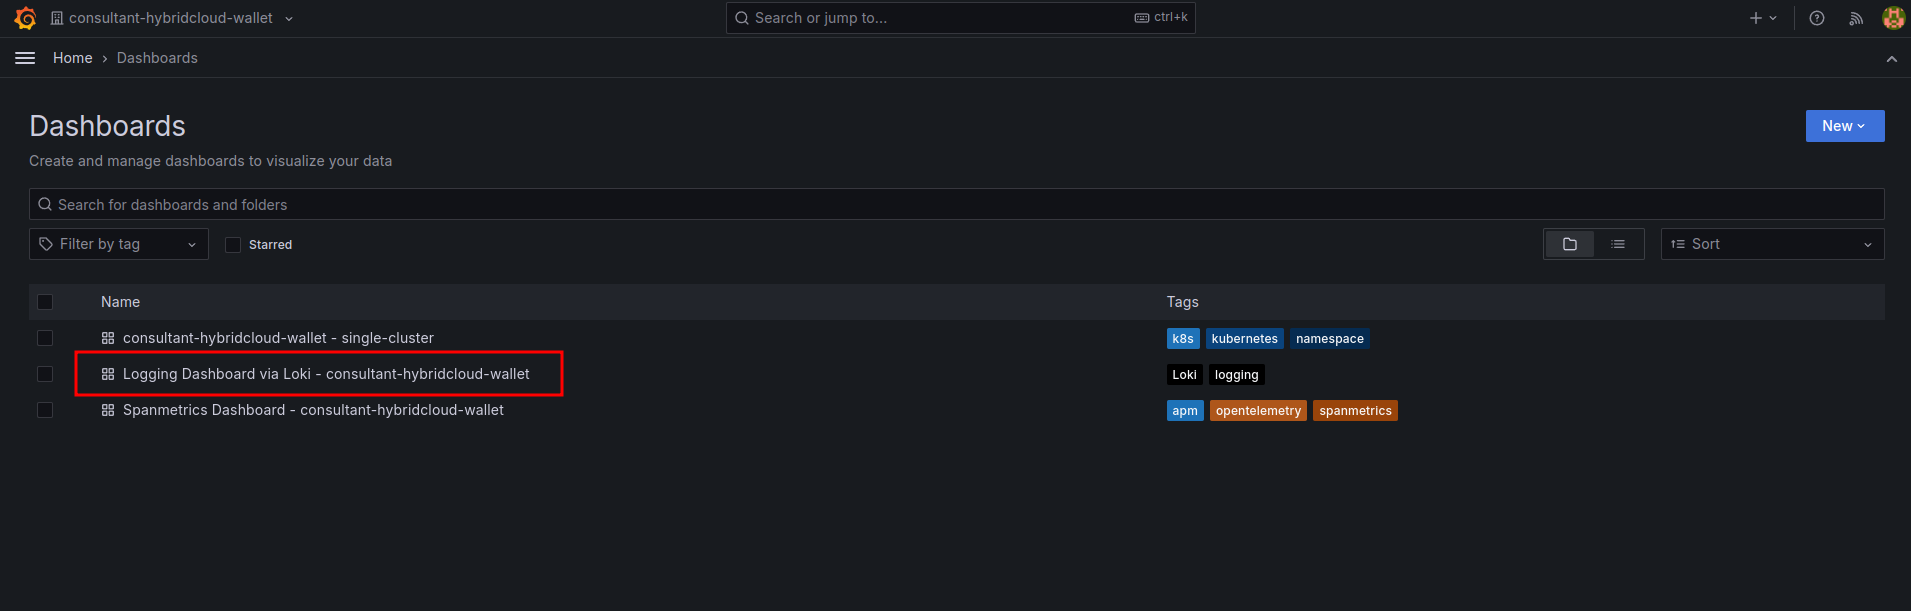
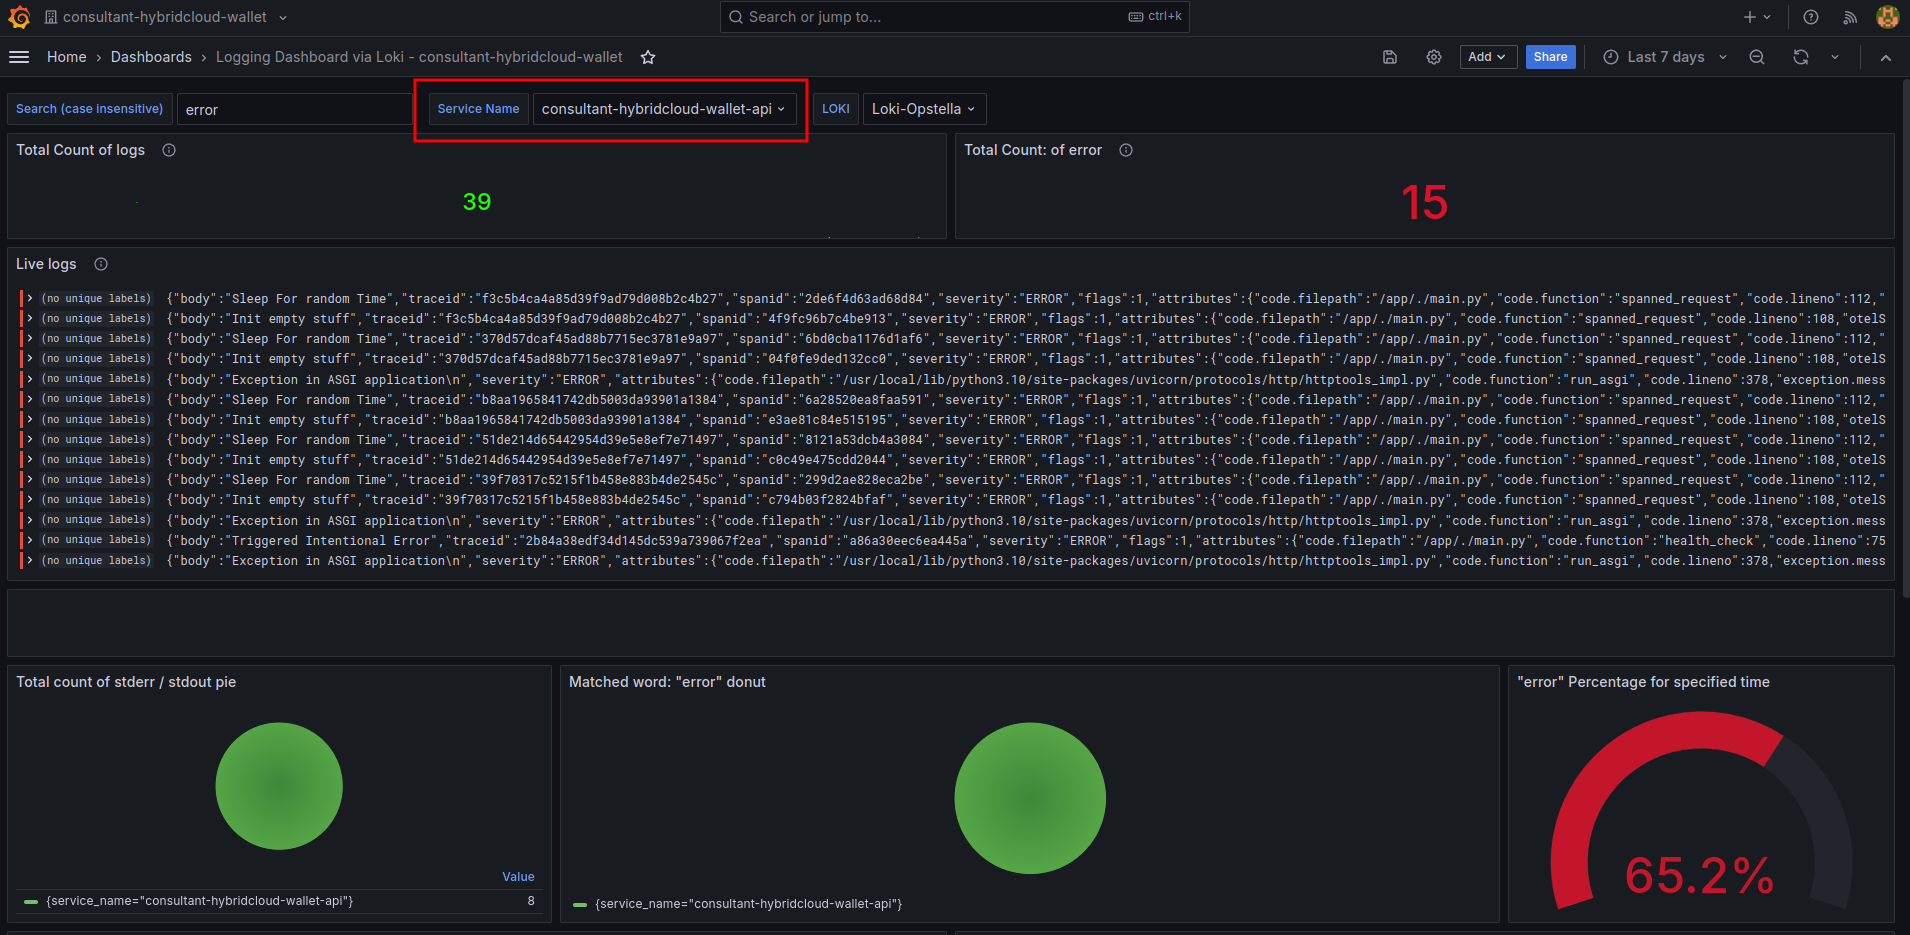
5.ระบบจะแสดง dashboard log โดยสามารถ filter service name ได้ ดังรูป